
Attributes
- Canva
- Instructional design
- Web design
- Visualization
- Google Sheets
- Visual presentation
- Illustration
Click here to access the infographic
Description
This infographic is one of the projects I did for the Learning Design and Technology graduate program. It is intended to simplify data using visualization tools.
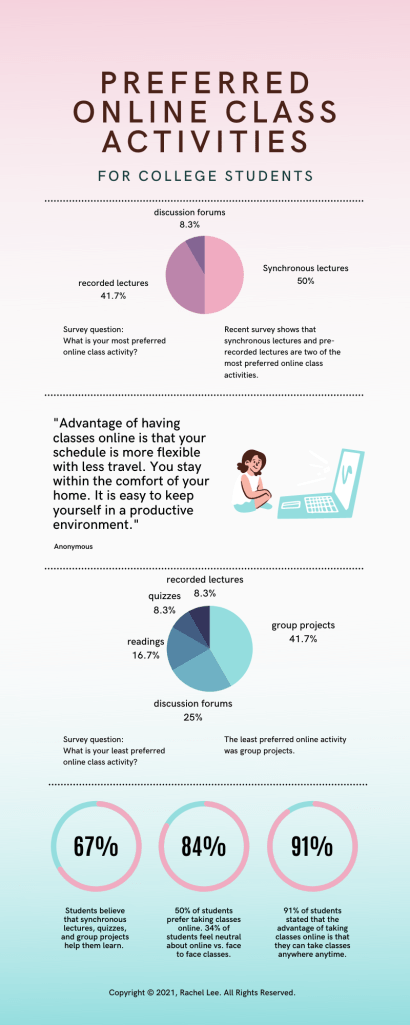
Research topic: college students’ perspectives on online class activities
Participants: students from the UMGC and students from the University of Maryland (12 participants)
This infographic aligns with Mayer’s multimedia design principles.
- Multimedia Principle – The visual in the middle and the data presentation produce greater learning outcomes.
- Coherence principle – The content is short and concise.
- Contiguity Principle – The explanation of data point are in close proximity.
- Segmenting principle – the information is chunked. This way, learners are better able to digest the content.
